
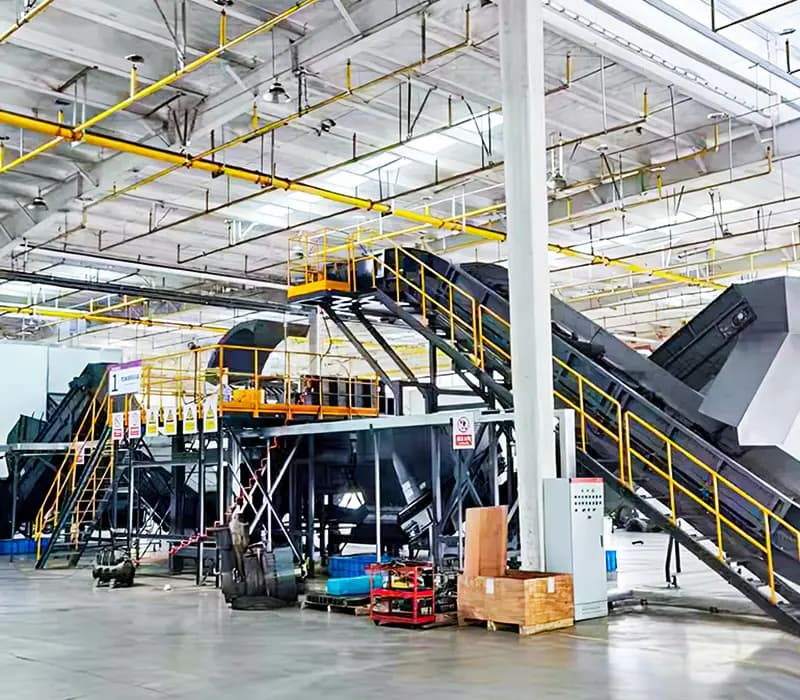
Tyre Pyrolysis Plant Costs: Variables, Scenarios and Investment Risks
There is no defensible universal plant price, margin or payback period. Build one model in the project currency from verified annual feed, a complete operating calendar, the installed project boundary, tested saleable outputs and contracted offtake conditions.
A quotation is not the total investment, a nameplate rate is not annual accepted feed, and a product yield is not revenue until the product meets a buyer specification. Payback and ROI are scenario outputs, never supplier promises.
Use one auditable model boundary
Keep units, dates, taxes, financing and currency assumptions visible. Every input should have an owner, evidence source and review date.
Qannual = Qcontracted × αacceptance × αavailabilityAnnual accepted feed after quality rejection and operating availability
Msaleable,i = Qannual × yi,tested × αsaleable,iSaleable output by stream from a tested mass balance and buyer acceptance
Contribution = Σ(revenueaccepted) − Σ(costboundary)Operating contribution from accepted revenue less all in-boundary operating costs
Funding = CAPEXinstalled + contingency + working capitalTotal project funding including installed capital, contingency and working capital
Separate installed capital from operating economics
Compare supplier proposals only after every inclusion, exclusion and site interface is placed on the same boundary.
Installed capital and start-up funding
- Feed receiving, sorting, tyre preparation, storage and internal handling
- Reactor package, condensation, gas use, solids cooling and product storage
- Civil works, buildings, utilities, fire protection, emissions and water controls
- Freight, duties, installation, commissioning, training, permits and acceptance testing
- Design contingency, ramp-up inventory, working capital and applicable financing or taxes
Annual revenue and operating cost boundary
- Contracted feed fees or feed acquisition cost, collection, rejection and inbound logistics
- Saleable oil value by tested specification, storage route and buyer acceptance
- Recovered carbon material value only after classification, upgrading and application approval
- Steel, gas and other streams only where a lawful, measured and accepted route exists
- Utilities, labor, consumables, testing, environmental monitoring, residue and wastewater handling
- Maintenance labor, critical spares, planned shutdowns, unplanned downtime and off-spec product
Run three scenarios on the same formulas
Change only declared inputs. Do not make the upside case the financing case and do not hide ramp-up or off-spec periods.
Downside case
Lower accepted feed and availability, conservative saleable recovery and offtake, higher utilities, maintenance and residue cost, slower permits or ramp-up, and sufficient liquidity to survive the result.
Evidence-backed base case
Contracted feed, scheduled operating calendar, representative test results, written product specifications, current local quotations and a documented maintenance and compliance plan.
Qualified upside case
Use only improvements supported independently by tests, signed commercial terms or demonstrated operating changes. Keep this case outside the minimum approval threshold.
Test the variables that can reverse the decision
Change one driver at a time, then combine the credible adverse movements. Rank the break-even drivers rather than presenting one attractive result.
- 01
Available and accepted feed volume, feed fee or acquisition cost
- 02
Full-line availability, campaign length, batch cycle and ramp-up
- 03
Tested mass balance, saleable recovery, quality rejection and product upgrading
- 04
Local offtake price, contract duration, indexation, storage and outbound logistics
- 05
Fuel, electricity, water, labor, consumables and environmental monitoring
- 06
Maintenance interval, critical spares, residue disposal, tax, currency and financing
Convert uncertainty into an evidence-and-control register
A risk is not closed by optimistic wording. Record the evidence required, the responsible party and the action if the assumption fails.
Feed supply and quality
- Evidence
- Source contracts, monthly delivery history, representative sampling and an acceptance envelope.
- Control
- Diversify qualified sources, define rejection rules and size buffer storage from measured variability.
Product quality and offtake
- Evidence
- Test methods, buyer specifications, samples, letters or contracts and an off-spec route.
- Control
- Do not book unaccepted output as revenue; budget testing, storage and any required upgrading.
Technical performance
- Evidence
- Project-specific mass and energy balance, comparable references, operating narrative and acceptance test.
- Control
- Define battery limits, performance conditions, exclusions, warranties and remedies in the contract.
Site, safety and compliance
- Evidence
- Plot plan, utility study, hazard review, emission points, residue routes and permit pathway.
- Control
- Complete local engineering and authority review before freezing equipment or construction scope.
Delivery and ramp-up
- Evidence
- Responsibility matrix, schedule logic, training plan, critical spares and commissioning protocol.
- Control
- Fund contingency and working capital; link milestones to evidence and acceptance rather than shipment alone.
Commercial and financial
- Evidence
- Dated local quotations, currency and tax basis, financing terms and downside cash-flow test.
- Control
- State escalation and exchange assumptions, preserve liquidity and reapprove the model when a major input expires.
Investment go/no-go evidence gates
Do not approve the project from a supplier price and headline output values alone.
- 1
Representative tyre samples and an agreed feed acceptance envelope
- 2
Closed project-specific mass and energy balance with unaccounted loss shown
- 3
Complete scope matrix covering equipment, civil works, utilities, controls and exclusions
- 4
Product specifications, sampling methods and credible offtake or disposal routes
- 5
Local permit, emissions, fire, water, waste and product-use pathway
- 6
Operating calendar, staffing, maintenance, spares and contractual acceptance test
- 7
Downside liquidity, contingency, working capital and documented approval assumptions